Research review · October 11, 2026

The research
behind the list.

A place on the list starts with a set of clues. We use screening formulas to study price drops, price strength and trading volume. Then we check what happened after those stocks were selected.

We have been building and testing DipSignal since spring 2026. The Steady research and Speculative bounce groups come from two screening formulas. They look for different kinds of dips, so we test them in different ways.

What the tests show

Two approaches.
Two different results.

These are early research results, before trading costs. They are averages across stocks in a test, not monthly earnings or returns earned by an account.

Price strength

Steady research

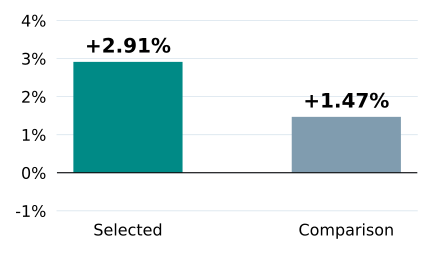
Average price return over 20 trading sessions
Selected: +2.91%. Comparison: +1.47%. Before trading costs.
Average return and sample size
GroupAverageCount
Selected+2.91%207
Comparison+1.47%443

Counted as stocks.
Pick dates: Jun 15, 2026 – Sep 1, 2026.

The selected stocks had a higher average in this sample. We still need fresh tests to learn how well that holds up.

Possible rebounds

Speculative bounce

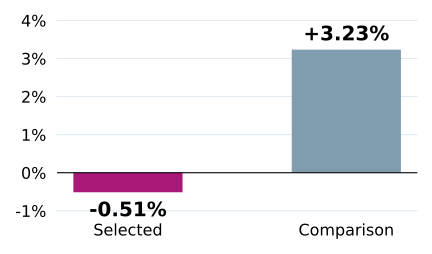
Average return under one fixed exit test
Selected: -0.51%. Comparison: +3.23%. Before trading costs.
Average return and sample size
GroupAverageCount
Selected-0.51%39
Comparison+3.23%1,050

Counted as stock-and-date observations.
Pick dates: Jun 30, 2026 – Sep 1, 2026.

This exit test did not beat its comparison group. We are keeping that result visible as the research continues.

What can we learn from this?

The steady approach had the higher average in its test. The bounce exit test fell behind its comparison group. Neither result proves what the next stock will do. These studies use different holding and exit methods, so their bars should not be used to rank one approach against the other.

These tests study the two research groups. They do not test the A, B and C grades or the order of every name in the full list.

Some price records were missing or could not be compared safely. The charts show only the records that could be used. We still need new tests with complete data before making stronger claims.

How to read these tests

Selected and comparison. Selected means the stocks that met that approach's formula. Comparison means other candidates from the same scan runs. It is not a market index.

Steady research. We compared closing prices from the signal date to 20 trading sessions later, using prices with the same adjustment basis. A session is one day the stock market is open. Each stock appears once in this comparison.

Speculative bounce. We used one fixed test of when to exit. It uses the next session's opening price after an exit signal, or a closing-price fallback after 20 sessions. A stock can appear on more than one date. This is a modeled exit test, not a record of real trades.

How certain is the steady result? A check that groups picks by date gives a 95% range of −2.60 to +5.45 percentage points for the difference. The range includes zero, so this check does not establish a lasting edge. It is a description of data already reviewed, not a fresh confirmation test.

Dates and costs. The review used available prices through September 30, 2026 and was corrected on October 11. Trading costs and taxes are not included. Returns from a real account also depend on when, how much and what someone trades.

What was left out? The steady chart has usable prices for 207 of 223 selected stock records and 443 of 690 comparison records. The bounce chart has 39 complete selected stock-and-date records out of 234 logged, and 1,050 out of 9,825 comparison records. Those totals include newer picks logged through October 9 that had not reached the end of their test, as well as missing or unusable prices. Later price recovery is not included in these chart results.

Why these numbers may differ from older charts. We use corrected comparisons here. Older charts may use different samples or price methods. These charts do not show a monthly growth rate.
The next step

From finding a name
to understanding it.

The list helps you find a stock to study. Plus builds on that work by bringing more company and market facts into the next part of your research. More context can help you ask better questions; it does not promise a better return.

Discover DipSignal Plus
DipSignal Plus · In development

Go beyond the price.

You found a stock worth a closer look. Plus is being built to bring the company and market facts around it into one place, so you can understand more of what is behind the price move.

The free leaderboard stays free.

A price move is only part of the story.

The priceWhat has changed?
The companyWhat is behind the move?
The marketWhat else should you know?

The bigger picture, brought together.Our direction for DipSignal Plus.

Find a name.
Then get to know it.

The free list gives you a place to start. Plus is our next step: more of the facts you need to understand what you find.

Available now

DipSignal Free

Find your next name to study.

  • The full ranked stock list
  • Clear A, B and C grades
  • Search and study group filters
  • Available charts, from one day to five years
Open the free list
In development

DipSignal Plus

Build a fuller picture of the stock.

  • Company and market facts together
  • More context behind a price move
  • A closer look at names you want to study

We will show the final features and subscription price before you choose to start.

See the reservation

Reserve your place
in Plus.

Reserve Plus with one payment. The full amount becomes credit toward access when you choose to start.

Your reservation, explained

Reservation payments support development and the company and market data used by Plus. This does not change your right to a refund under these terms.

Review Plus when it is ready

We aim to offer access by February 28, 2027 (Mountain Time). If we miss that date, we will issue a full refund. Your bank may take time to post it.

Choose access or a refund

You can ask for a full refund any time before you accept and start Plus access. You can also choose a refund if the final offer does not fit your needs.

Ask about Plus or a refund
Plus reservation

Your Plus reservation

$19.00 USD once

Your full payment becomes credit

The full $19.00 goes toward Plus when you choose to start. This does not buy a set number of months. We will show the final features and subscription price before you decide.

This is one payment. It will not start a subscription or renew on its own. The free leaderboard stays free.

Reserve Plus for $19.00

Pay securely on Stripe in a new tab. Check the price and terms before paying, then keep your receipt as proof of payment.

More context. Your judgment.

More facts can help you ask better questions. They cannot tell you for sure what a stock will do. Study the business and the risks before you decide.

Your next idea starts with a name.

Head back to the list. Pick a stock, check its grade and explore its chart.

Explore the leaderboard